If you’re having trouble reading this, click here.
MONDAY ECONOMIC REPORT
Inflation Moderates as Real Wages Decline
August 17, 2026
By Michael Green
Manufacturing-Focused Weekly Toplines
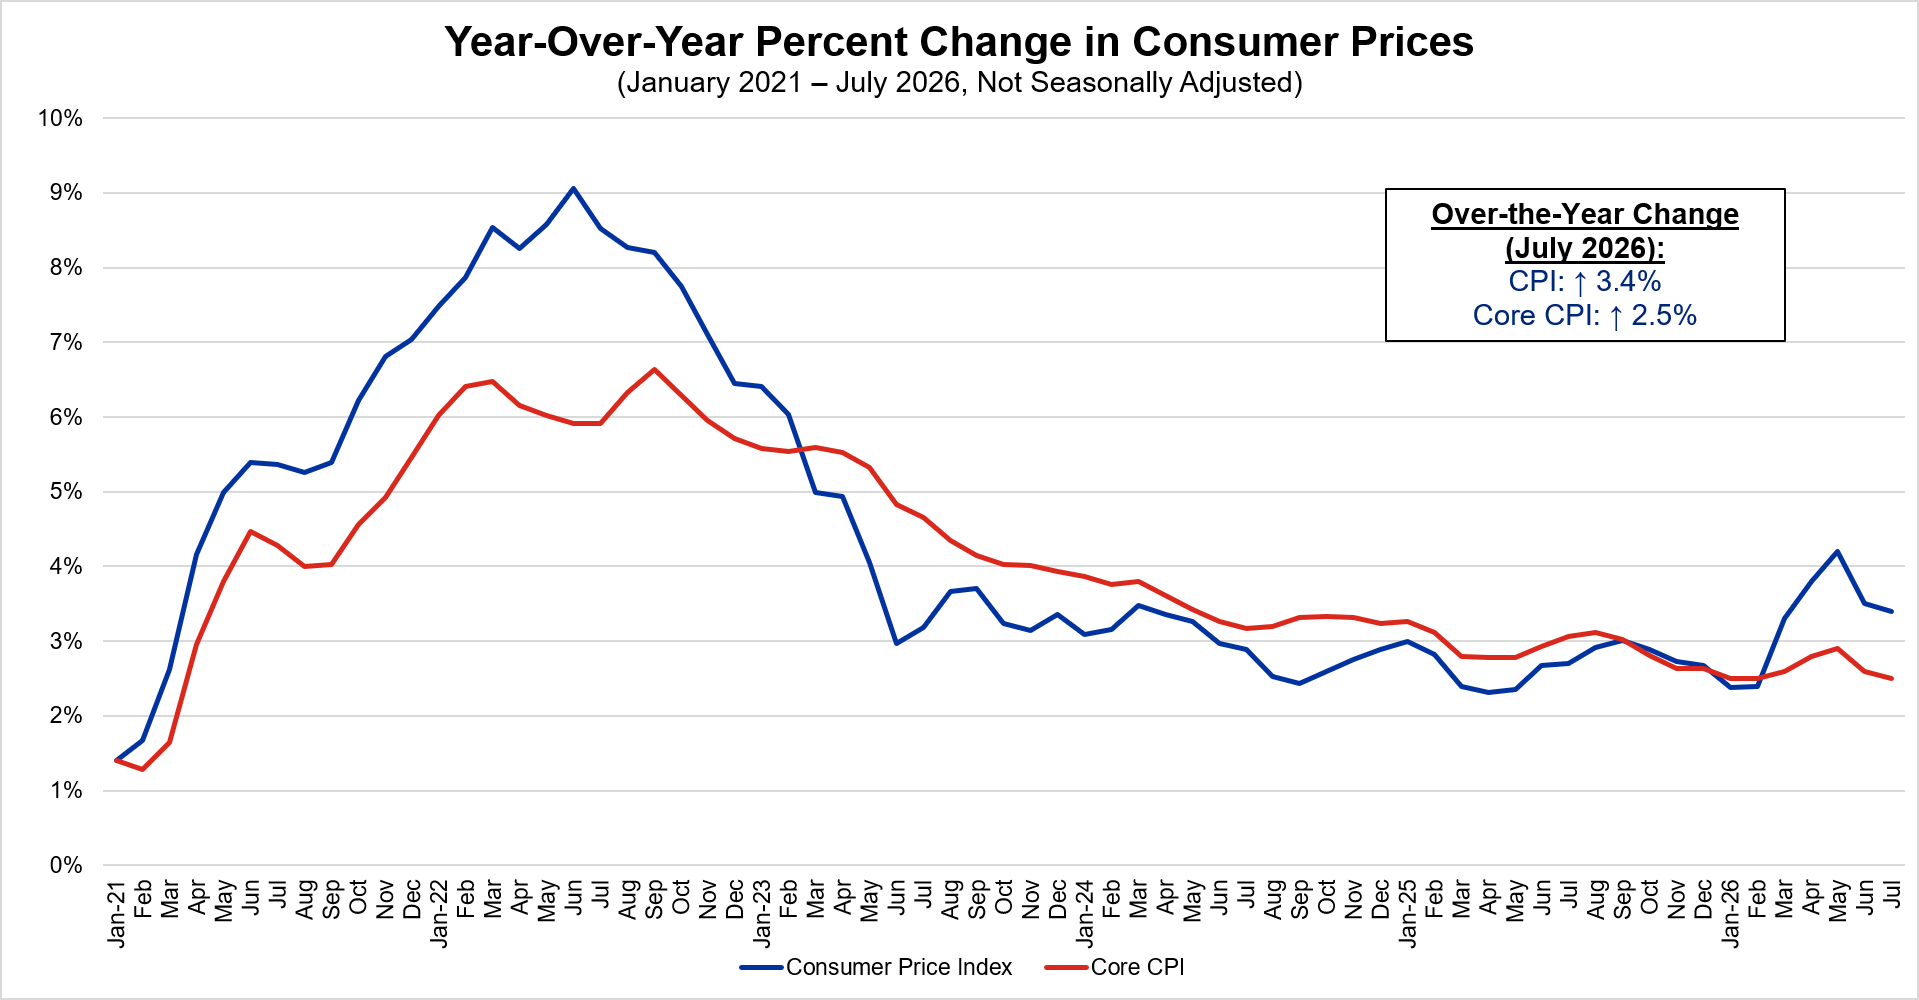
Consumer price growth slows in July: In July, consumer prices increased 0.1% from June and 3.4% over the year, down from the 3.5% annual rise in June. Core CPI, which excludes more volatile energy and food prices, rose 0.2% in July and 2.5% over the year, down from the 2.6% 12-month growth the month prior.
Why it matters: After a decline in consumer prices in June, price pressures eased further in July. Energy prices continued to fall, declining 1.5% over the month after dropping 5.7% in June. Within the index, gasoline prices decreased 2.9% but rose 24.6% year-over-year. Markets still anticipate the Federal Open Market Committee will keep rates unchanged at their next meeting in September.
Meanwhile, producer prices slow as well: Wholesale prices, which tend to give an early look at where consumer prices are heading, stayed the same over the month after declining 0.1% in June. Meanwhile, producer prices increased 4.7% over the year in July, down from the 5.5% jump in June. Prices for services moved up 0.2%, while prices for goods declined 0.7% in July.
What it means: Over half of the decline in prices of processed goods in July could be attributed to a 5.7% drop in the price of gasoline. At the same time, prices for diesel fuel fell 6.7% over the month but surged 44.2% from July 2025. Overall core PPI, which excludes food and energy, ticked up 0.1% in July and increased 4.2% over the year, down from the 4.7% annual rise seen in June.
Real earnings decline amid stubborn inflation: Real average hourly earnings for all employees declined 0.2% over the year in July as a result of a 3.2% rise in average hourly earnings combined with a 3.3% gain in inflation. Meanwhile, real average hourly earnings for production and nonsupervisory employees fell 0.1% over the year.
Why it matters: Price pressures continued to erode real wage gains for both frontline employees and employees of all industries. Despite increasing payrolls, declining real wages could compound labor market pressures.
This Week’s Economic Indicators
Monday, Aug. 17 Empire State Manufacturing Survey NAHB Housing Market Index
Tuesday, Aug. 18 Industrial Production and Capacity Utilization U.S. Import and Export Price Indexes New Residential Construction Pending Home Sales
Wednesday, Aug. 19 None
Thursday, Aug. 20 Philadelphia Fed Manufacturing Business Outlook Survey
Friday, Aug. 21 S&P Global Flash Manufacturing PMI
Deeper Dive
Consumer Price Index: In July, consumer prices increased 0.1% from June and 3.4% over the year, down from the 3.5% annual rise in June. Core CPI, which excludes more volatile energy and food prices, rose 0.2% in July and 2.5% over the year, down from the 2.6% 12-month growth the prior month.
Producer Price Index: The Producer Price Index for final demand (also known as wholesale prices) was unchanged over the month in July after edging down 0.1% in June. Over the year, producer prices increased 4.7%, down from the 5.5% gain in June. Meanwhile, prices for final demand excluding foods, energy and trade services climbed 4.7% from July 2025, down from the 5.0% increase in June.
Real Earnings:Real average hourly earnings decreased 0.1% in July as a result of a 0.1% rise in average hourly earnings combined with a 0.1% uptick in inflation. Meanwhile, real average weekly earnings stayed the same due to the change in real average hourly earnings combined with no change in the average workweek in July. In the past year, real average hourly earnings declined 0.2%, while the average workweek stepped up 0.3%, resulting in a 0.1% rise in real average weekly earnings compared to July 2025.
For production and nonsupervisory employees, real average hourly earnings stayed the same in July as a result of a 0.1% increase in average hourly earnings and a 0.1% uptick in inflation. Real average weekly earnings for this group advanced 0.1% due to the change in average hourly earnings and no change in the average workweek. In the past year, real average hourly earnings for this group decreased 0.1%, and the average workweek rose 0.3%, resulting in a 0.2% increase in real average weekly earnings from July 2025.
NFIB Small Business Survey:The NFIB Small Business Optimism Index increased 2.4 points to 99.8 in July, climbing above the 52-year average of 98. July’s gain was due to an improvement in hiring and capital investment plans. Of the 10 components in the index, eight increased and two decreased. Meanwhile, the Uncertainty Index rose 2 points to 91, still well above the 51-year average (68) and above the average since 2016 (80).
Existing Home Sales: Existing home sales decreased 1.7% in July but rose 0.7% over the year. Housing inventory moved down to 1.54 million units, declining 1.9% from June and 0.6% from last year. The median existing home price was $434,100, up 2.0% from last year. In July, the Northeast posted a monthly increase, while the Midwest and South experienced declines and the West was unchanged.
Single-family home sales stepped down 1.9% from June but increased 0.8% from July 2025, with the median price growing 1.9% from last year to $440,300. Condo and co-op sales stayed the same in July and were unchanged from last year at 370,000 units in July. Meanwhile, the median price for condos and co-ops advanced 2.2% from the prior year to $371,800.
Homes were typically on the market for 29 days in July, up from 28 days in June and 28 days in July 2025. First-time buyers made up 29% of sales in July, down from 33% in June but up from 28% in July 2025.
University of Michigan Consumer Sentiment Index (Preliminary):In August, consumer sentiment fell 7.6% to an index reading of 51.0 after advancing 11.5% the prior month. Current economic conditions declined 5.5%, while the expectations index decreased 8.7%. The loss in sentiment was broad based, though sentiment among Republicans hit its lowest point since the 2024 election. At the same time, expected business conditions stepped down 11% in the short run and 17% in the long run as uncertainty continues.
Year-ahead inflation expectations ticked up from 4.2% in July to 4.3% in August. At the same time, long-run inflation expectations remained at 3.3% in August. Looking forward, only 8% of consumers surveyed expect their income growth to exceed inflation in the year ahead, a decline from 18% in December 2024.
Manufacturing Inventories and Sales:In June, manufacturers’ sales declined 0.2% from May but rose 8.2% from June 2025. Manufacturers’ inventories ticked up 0.1% in June and increased 1.8% from the same month a year ago. The manufacturers’ inventories/sale ratio stood at 1.48 at the end of June, up from 1.47 the prior month but down from 1.57 recorded in June 2025.
Get Involved
Your Response Needed: NAM’s Q3 Manufacturers’ Outlook Survey If you haven’t already, please take a moment to answer the NAM’s Q3 Manufacturers’ Outlook Survey, which includes special questions about business impacts of the ongoing conflict in the Middle East, industrial machinery imports and transportation modes and challenges. This survey will help the NAM gauge how manufacturing sentiment has changed since the Q2 survey.Responses are due by Thursday, Aug. 27, at 5:00 p.m. EDT. As always, all responses are anonymous. If you have any questions about the survey, contact NAM Economist Michael Green.