If you’re having trouble reading this, click here.
MONDAY ECONOMIC REPORT
Manufacturing Output Rises as Regional Surveys Signal an Acceleration
August 24, 2026
By Michael Green
Manufacturing-Focused Weekly Toplines
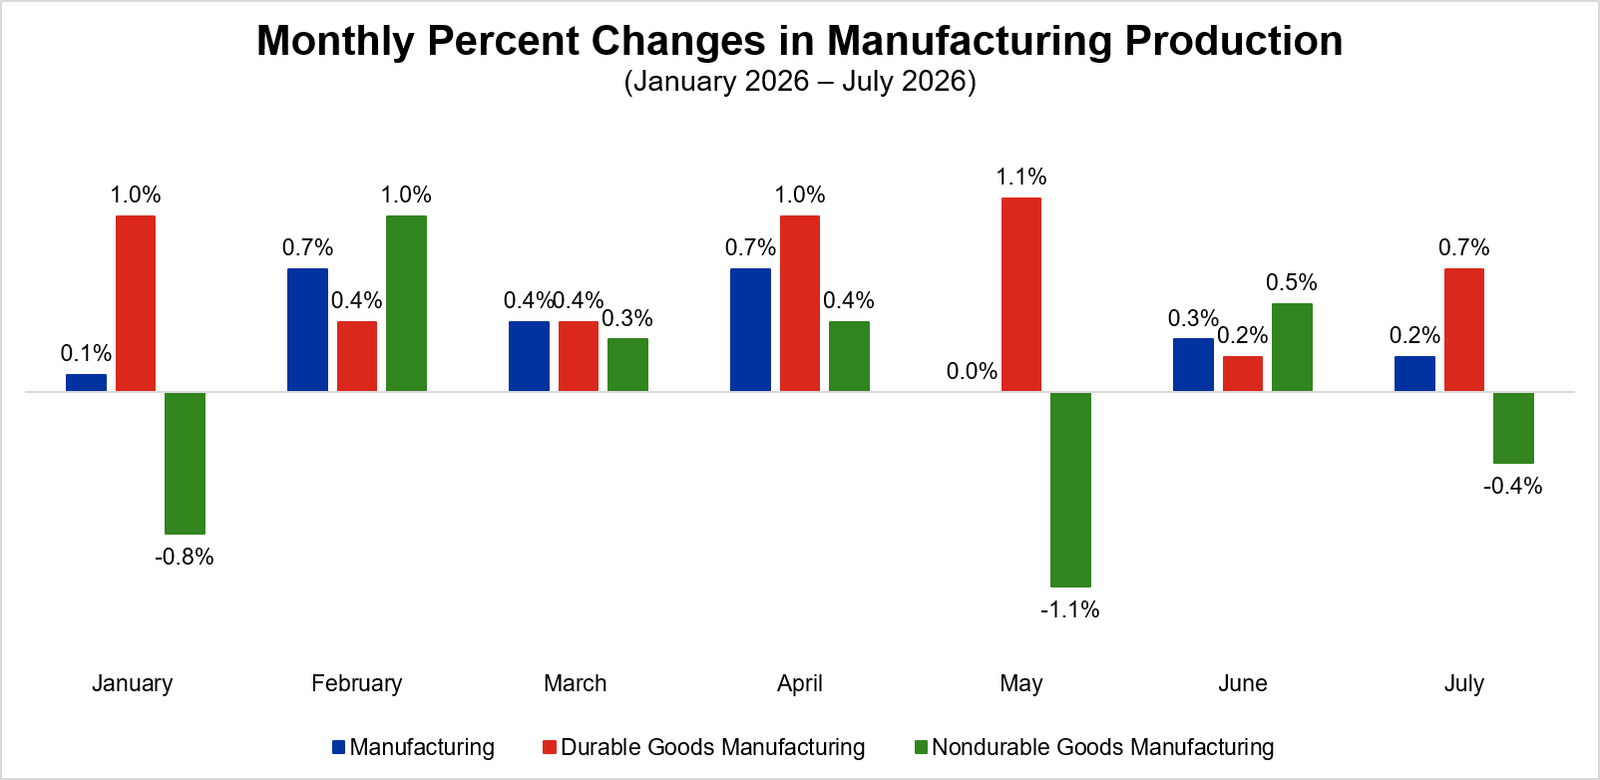
Manufacturing production rose in July: Manufacturing output increased 0.2% in July after rising 0.3% in June. At 98.4% of its 2017 average, manufacturing production rose 1.2% over the past year. Capacity utilization for manufacturing was 76.0%, up slightly from 75.9% in June and up 1.0% over the past year. Capacity utilization remained 2.3 percentage points below its long-term average from 1972 to 2025.
What it means: Manufacturing production rose at an annual rate of 5.4% in the second quarter. At the same time, durable goods manufacturing advanced 3.9% from July 2025, while nondurable goods declined 1.6% from a year prior. The largest annual gain occurred in computer and electronic products (up 9.9%), while furniture and related products posted the largest decline (down 5.0%).
Philadelphia manufacturing expanded in August: Philadelphia’s regional manufacturing activity expanded to its highest level since April 2021, with the index for general business activity climbing from 41.4 to 47.4. This month, 56.9% of firms noted increases in activity, while 9.6% reported decreases. New orders and shipments both declined, moving down from 37.0 to 30.1 and from 33.7 to 27.7, respectively.
What it shows: Looking ahead, expectations for future business activity surged 39.2 points to 73.6 in August, the highest level since August 1983. At the same time, the capital expenditures index jumped from 30.1 to 48.2, its best reading in 53 years. In line with this jump in activity and expectations, the current employment index improved to its best point since April 2022, rising 17.9 points to 27.9.
Manufacturing activity expanded at a faster pace in New York: Manufacturing activity in New York state expanded at a faster pace in August, with the headline business conditions index rising 5.0 points to 20.6. The new orders index decreased 4.9 points to 17.3, while the shipments index fell 12.7 points to 11.7. At the same time, the prices paid index stepped up from 52.3 to 58.6, while the prices received index decreased from 27.6 to 22.7.
Why it matters: In August, the business conditions index hit its highest point in more than four years. Looking forward, firms’ optimism about the future strengthened. Notably, the future employment index climbed 13.8 points to 28.2, suggesting a faster pace of employment growth in the next six months.
Flash PMI signaled slower expansion in manufacturing activity: The S&P Global Flash U.S. Manufacturing PMI fell from 53.9 to 53.2 in August, a five-month low. Factory production slowed to its lowest level since July 2025, while new orders growth rose at its slowest pace since March. Meanwhile, manufacturing employment rose at its fastest pace since May.
What it means: While the Flash PMI is only an early estimate of manufacturing activity based on 85% of responses, it can give an indication of where activity is trending. Despite the slowdown in manufacturing growth, overall business activity hit a 52-month high in August. Further, expansions in both manufacturing and the services sector led to improvements in optimism about future business conditions.
This Week’s Economic Indicators
Monday, Aug. 24 None
Tuesday, Aug. 25 Richmond Fed Survey of Manufacturing S&P Cotality Case-Shiller Home Price Index Conference Board Consumer Confidence
Wednesday, Aug. 26 GDP (Q2 2025 Second Estimate) Durable Goods (Advance) Personal Income and Outlays PCE Price Index
Thursday, Aug. 27 None
Friday, Aug. 28 University of Michigan Consumer Sentiment Index (Final)
Deeper Dive
Industrial Production and Capacity Utilization: Industrial production ticked up 0.2% in July, while manufacturing output rose by a similar amount after increasing 0.3% in June. At 98.4% of its 2017 average, manufacturing production moved up 1.2% from July 2025. Capacity utilization for manufacturing was 76.0%, up slightly from 75.9% in June and up 1.0% over the past year. Capacity utilization remained 2.3 percentage points below its long-term average from 1972 to 2025.
Philadelphia Fed Manufacturing Business Outlook Survey: In August, Philadelphia’s regional manufacturing activity expanded to its highest level since April 2021, with the index for general business activity climbing from 41.4 to 47.4. This month, 56.9% reported increases, while 9.6% reported decreases. New orders declined, moving down from 37.0 to 30.1, while shipments decreased from 33.7 to 27.7. Meanwhile, employment improved to its highest level since April 2022, jumping 17.9 points to 27.9, and the average workweek grew 12.5 points to 26.5.
Empire State Manufacturing Survey: Manufacturing activity in New York state expanded at a faster pace in August, with the headline business conditions index rising 5.0 points to 20.6. The new orders index decreased 4.9 points to 17.3, while the shipments index fell 12.7 points to 11.7. Unfilled orders climbed 10.5 points to 15.5, while inventories moved down 9.2 points to -5.2, indicating business inventories shrank in August. Delivery times lengthened, with the index increasing 7.6 points to 20.6, and supply availability worsened, stepping down 3.4 points to -13.4.
S&P Global Flash U.S. Manufacturing PMI: The S&P Global Flash U.S. Manufacturing PMI fell from 53.9 to 53.2 in August, a five-month low. Factory production slowed to its lowest level since July 2025, while new orders growth rose at its slowest pace since March. Meanwhile, manufacturing employment rose at its fastest pace since May.
U.S. Import and Export Price Indexes: U.S. import prices decreased 0.4% in July after declining 0.3% in June, with lower prices for fuel imports more than offsetting higher prices for nonfuel imports. Over the year, import prices advanced 5.9%. Meanwhile, U.S. export prices stepped down 1.3% in July, driven by lower prices for nonagricultural exports. Over the past year, export prices jumped 8.2%.
In July, U.S. import prices for manufacturing moved up 4.7% over the year, as almost all of the industry experienced price increases. Petroleum and coal products manufacturing experienced the most significant over-the-year U.S. import price increase in July, jumping 26.8%. On the other hand, the greatest yearly decline in U.S. import prices occurred in beverage and tobacco product manufacturing, which declined 1.9% from July 2025. Meanwhile, U.S. export prices for manufacturing advanced 7.5% over the year, with petroleum and coal products manufacturing exhibiting the largest rise (31.3%).
New Residential Construction: Building permits increased 5.0% in July and 3.1% over the year. Permits for single-family homes in July rose 2.5% and 1.1% over the year. At the same time, permits for buildings with five or more units climbed 9.1% from June and 6.3% over the year.
NAHB Housing Market Index: Builder confidence in the market for new single-family homes was 35 in August, up 1 point from July. One component of the Housing Market Index strengthened in August, while two components stayed the same. Present sales conditions stepped up 2 points to 39, while expected sales in the next six months were unchanged at 43. At the same time, traffic of prospective buyers remained at 23. The share of builders cutting prices was 35% in August, down from 37% in July. Meanwhile, the average price reduction was 6%, unchanged from July.
Pending Home Sales: In July, pending home sales decreased 2.3% over the month and 2.2% over the year, with all four regions experiencing declines. The Pending Home Sales Index, which predicts home sales through contract signings, fell to 71.2 in July, down from 72.9 in June.
Breaking it down by region: The Northeast moved down 2.0% over the month and 0.2% over the year. The Midwest ticked down 0.7% over the month but rose 1.7% over the year. Meanwhile, the South declined 2.2% month-over-month and 3.0% year-over-year. The West fell 4.7% over the month and 7.1% from July 2025.
Existing home sales fell to their lowest level since January as home prices remained at record highs. At the same time, mortgage rates remained elevated and continued to slow home sales. Looking forward, gains in the labor market and pent-up demand could support sales in the future.