If you’re having trouble reading this, click here.
MONDAY ECONOMIC REPORT
Manufacturers Remain Optimistic About Future as Corporate Profits Surge
August 31, 2026
By Michael Green
Manufacturing-Focused Weekly Toplines
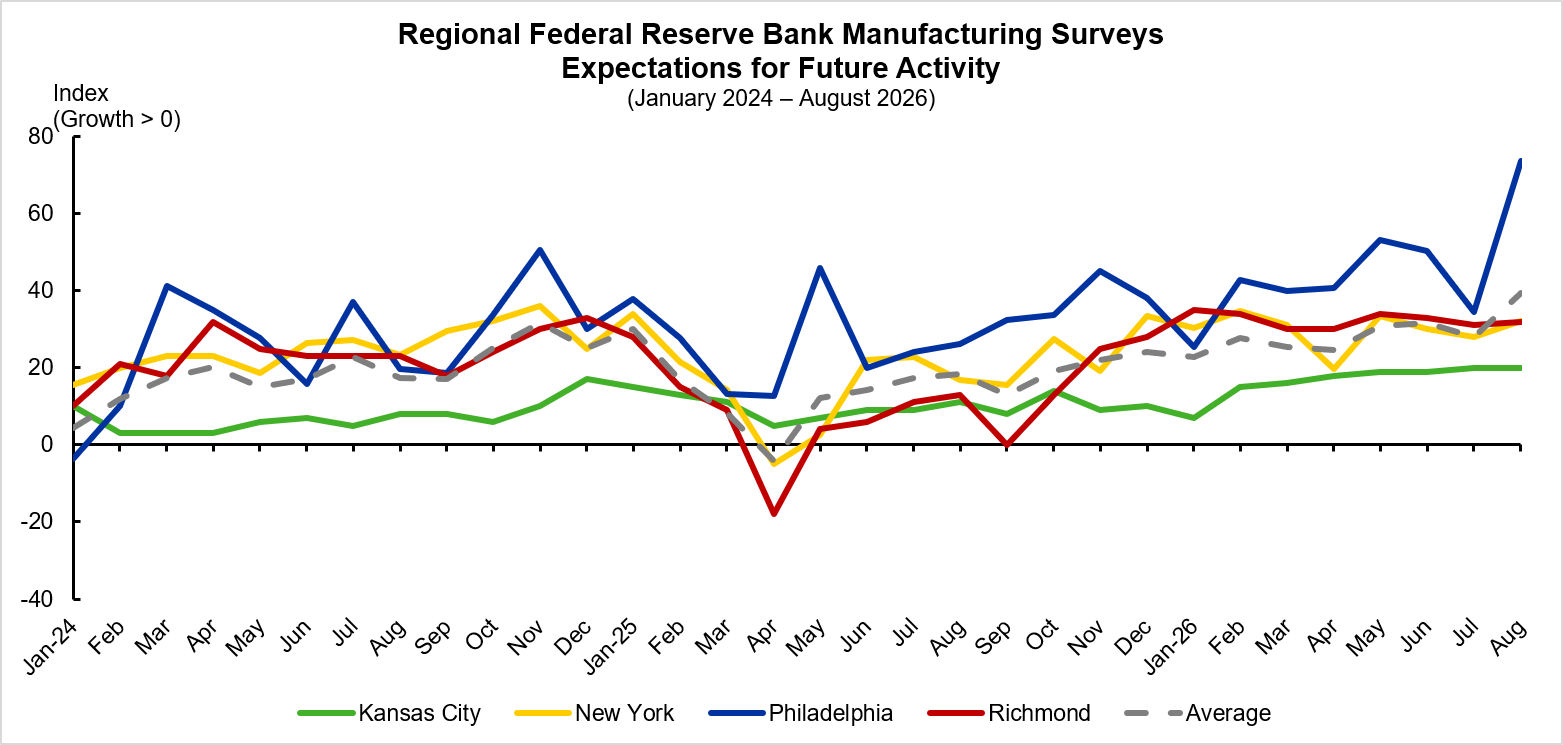
Kansas City manufacturing activity expanded in August: The month-over-month composite index in the Tenth District ticked up 1 point from 9 in July to 10 in August, while expectations for future activity were unchanged at 20. The production index stayed the same at 17, while the shipments index stepped down from 20 to 17. Meanwhile, the new orders index rose from 10 to 16, while the employment index declined from 2 to 0.
Why it matters: In August, all indices were positive except for new orders for exports. Despite the future activity index being unchanged over the month, expectations for future activity remain largely positive. Further, the indices for expected new orders and new export orders both increased, moving up from 28 to 36 and from -1 to 1, respectively.
Manufacturing activity expanded at a slower pace in Richmond: The composite manufacturing index in the Fifth District ticked down from 5 to 4 in August. Shipments rose from 8 to 11, while new orders stepped down from 5 to 3. Meanwhile, the local business conditions index decreased from 10 to 4 in August.
What it means: Despite a slight decline in the outlook for future local business conditions, the future new orders index remained elevated, ticking up from 31 to 32 in August. At the same time, firms’ expectations on capital expenditures and equipment and software spending turned positive, rising from -6 to 4 and from -5 to 2, respectively.
Corporate profits rose in the second quarter: Economy-wide corporate profits jumped 9.1% in the second quarter after rising 1.7% the quarter prior. Corporate profits advanced 22.8% from Q2 2025.
What it shows: Domestic industry profits grew 9.9% in Q2, the fifth consecutive quarterly increase. Further, domestic industry profits are up 22.8% in the past year. In contrast, profits from the rest of the world saw a 3.5% increase in the second quarter.
Another measure of inflation slowed in July: After the previously released CPI and PPI inflation measures cooled in July, the PCE price index stalled. The PCE price index, the preferred inflation gauge for the Federal Reserve, increased 0.2% over the month and 3.7% over the year, unchanged from the 3.7% year-over-year increase in June. Prices for goods declined 0.1%, while prices for services rose 0.3%.
Why it matters: Falling energy prices helped keep inflation stable in July, as prices for gasoline and other energy goods fell 2.7%. At the same time, when excluding food and energy, the core PCE price index advanced 0.2% over the month and 3.3% over the year, well above the Federal Reserve’s 2% target.
This Week’s Economic Indicators
Monday, Aug. 31 Texas Manufacturing Outlook Survey
Tuesday, Sept. 1 ISM Manufacturing Index Construction Spending Job Openings and Labor Turnover Survey
Wednesday, Sept. 2 Factory Orders
Thursday, Sept 3. Productivity and Costs (Revised) International Trade
Friday, Sept. 4 Employment Situation
Deeper Dive
Kansas City Fed Manufacturing Survey: Manufacturing activity grew at a slightly faster pace in the Tenth District in August, with the month-over-month composite index ticking up to 10 from 9 in July. Meanwhile, expectations for future activity stayed the same at 20. The month-over-month activity uptick was due to gains in paper and printing manufacturing offsetting slowing in durable manufacturing growth. At the same time, all indices except exports were positive, as the index for new orders for exports moved from -1 to -2. The Tenth Federal Reserve District encompasses the western third of Missouri; all of Kansas, Colorado, Nebraska, Oklahoma and Wyoming; and the northern half of New Mexico.
Richmond Fed Survey of Manufacturing Activity: Manufacturing activity in the Fifth District rose at a slower pace in August after ticking up in July, with the composite manufacturing index edging down from 5 to 4. At the same time, local business conditions stepped down but remained positive, declining from 10 to 4 in August. In line with a weakening of business conditions, manufacturers are slightly less optimistic about the future, with the outlook for future local business conditions decreasing from 19 to 16. The Fifth District consists of Virginia, Maryland, the Carolinas, the District of Columbia and most of West Virginia.
Corporate Profits (Q2 2026 Preliminary Estimate): Economy-wide corporate profits jumped 9.1% in the second quarter and are up 22.8% from Q2 2025. Domestic industry profits grew 9.9% from the previous quarter and 22.8% in the past year. Profits for domestic nonfinancial corporations increased $309.6 billion, up from the $143.3 billion rise in the first quarter. Profits for domestic financial corporations rose $71.6 billion in the second quarter, after declining $3.8 billion in the prior quarter. Profits from the rest of the world saw a 3.5% increase in the second quarter.
PCE Price Index: In July, the PCE price index, the preferred inflation gauge for the Federal Reserve, increased 0.2% over the month and 3.7% over the year, unchanged from the 3.7% year-over-year increase in June. Prices for goods declined 0.1%, while prices for services stepped up 0.3%. Within the goods category, gasoline and other energy goods prices fell 2.7%, while prices for recreational goods and vehicles grew 1.1%. When excluding food and energy, the core PCE price index increased 0.2% over the month and 3.3% over the year, a similar rise as in May and lower than the overall inflation rate.
Conference Board Consumer Confidence: Consumer confidence decreased 0.8 points in August to 89.4. Among its components, the Present Situation Index improved while the Expectations Index contracted as customers’ concerns regarding the present situation eased and concerns about the future worsened.
S&P Cotality Case-Shiller Home Price Index: In June, the S&P Cotality Case-Shiller U.S. National Home Price Index recorded a 1.5% annual gain, up from a 1.2% rise in May. The 10-City Composite increased 2.9% year-over-year, up from a 2.4% gain the previous month, while the 20-City Composite moved up 2.1%, up from 1.6% in May. Chicago again posted the highest annual gain at 6.9%, followed by New York at 4.8% and Cleveland at 4.1%. Meanwhile, Seattle posted the lowest annual return, with prices falling 2.0%.
GDP (Q2 2026 Second Estimate): Real GDP in the second quarter of 2026 grew at an annual rate of 1.5% in the second estimate, unchanged from the first estimate. In the first quarter of 2026, real GDP increased 2.1%. The update primarily reflected an upward revision to consumer spending that was offset partially by an upward revision to imports. The slower rise in GDP during the second quarter was mostly reflective of a downturn in government spending, which declined 1.0% after rising 4.4% in the first quarter. Further, investment and exports grew at a slower rate in the second quarter, advancing 2.7% and 4.5%, respectively. Current dollar GDP rose at an annual rate of 8.0%, reflecting a slight upward revision of 0.1 percentage point from the prior estimate, while the price index for gross domestic purchases increased 5.8%, revised up 0.1 percentage point from the previous estimate.
Personal Income and Outlays: Personal income grew $115.1 billion, or 0.4%, in July. Disposable income, which is personal income after taxes, rose $125.9 billion, or 0.5%. Meanwhile, personal consumption expenditures increased $36.3 billion, or 0.2%. The personal saving rate, which is personal saving as a percentage of disposable income, was 3.0%, up 0.4 percentage points from June.
Durable Goods (Advance): New orders for manufactured durable goods rose 1.1% in July, up $3.6 billion to $339.3 billion, following a 0.5% gain the prior month. Meanwhile, new orders for manufactured durable goods climbed 7.6% over the year. Transportation equipment led the increase, moving up 2.3% over the month, with nondefense aircraft and parts up 12.7% in July. When excluding transportation, new orders stepped up 0.4% over the month and jumped 9.2% over the year.
University of Michigan Consumer Sentiment Index: In August, consumer sentiment fell 6.3% to an index reading of 51.7, after rising 11.5% the prior month. Current economic conditions declined 5.3%, while the expectations index decreased 7.0%. As policy uncertainty continues, respondents anticipate higher gasoline prices in the short and long term. Overall, the loss in sentiment was largest for lower- and middle-income consumers, older consumers and those with limited stock holdings.
Year-ahead inflation expectations ticked down from 4.2% in July to 4.0% in August. Meanwhile, long-run inflation expectations were unchanged at 3.3% in August, slightly higher than the range seen in 2024. At the same time, expected year-ahead business conditions fell 10%, while five-year expected business conditions dropped 13%.