If you’re having trouble reading this, click here.
MONDAY ECONOMIC REPORT
Employment Growth Continues Amid Activity Gains
September 08, 2026
By Victoria Bloom and Michael Green
Manufacturing-Focused Weekly Toplines
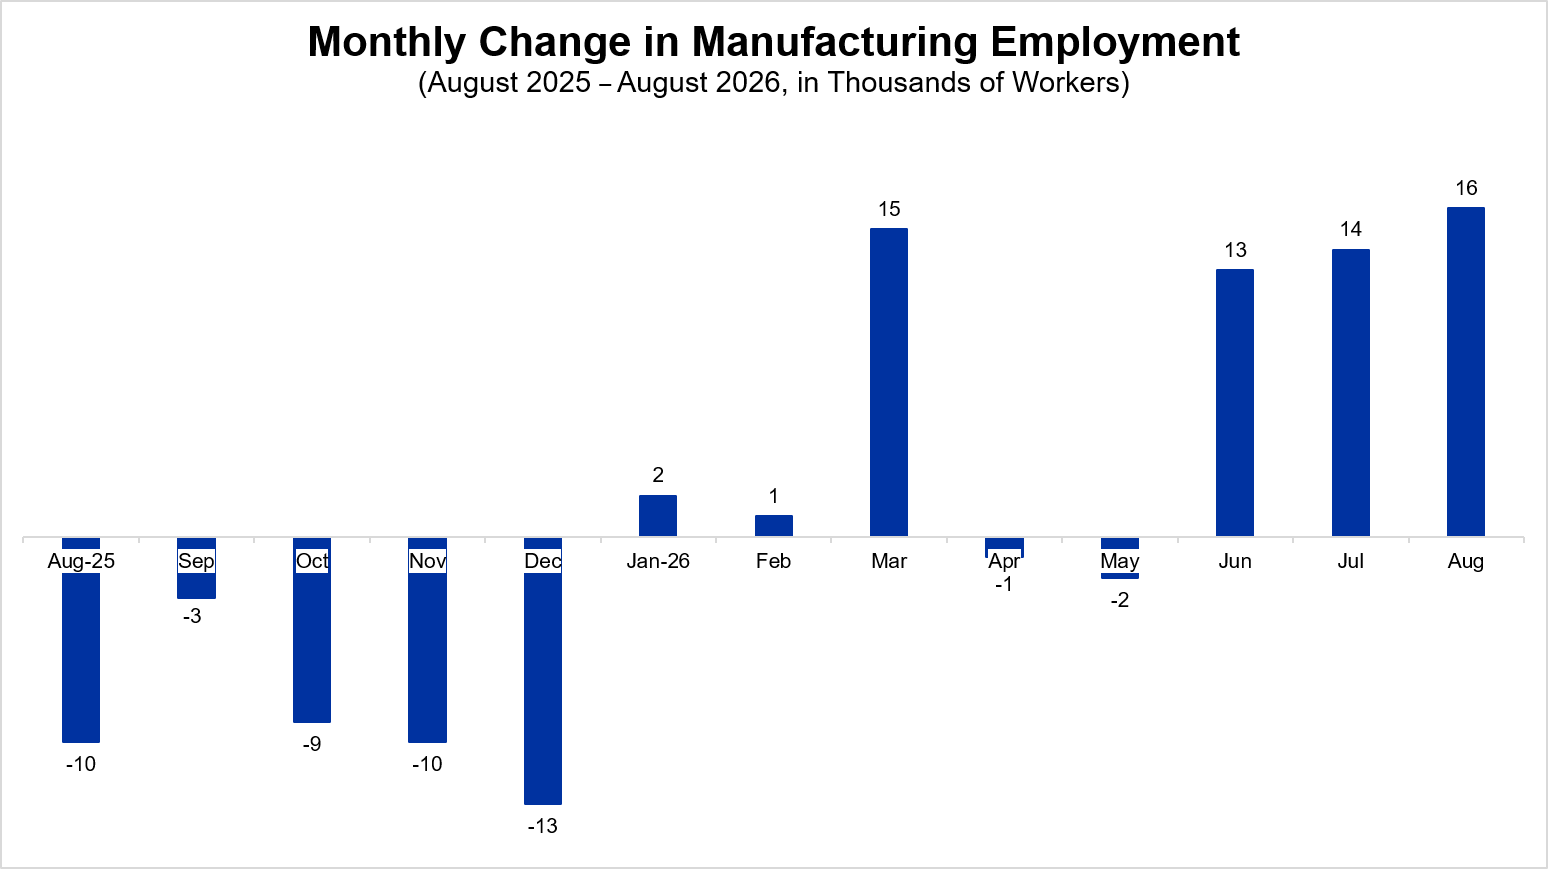
Manufacturing employment grows in August: Manufacturing employment increased by 16,000 after gaining 14,000 in July. Meanwhile, nonfarm payroll employment rose by 162,000, coming in above expectations. At the same time, the unemployment rate was unchanged at 4.1%, while the labor force participation rate ticked up 0.2% to 61.6% but is down from 62.3% in August 2025.
Why it matters: Manufacturing employment is up 23,000 jobs over the year, the first positive year-over-year gain since September 2023. Further, manufacturing job gains in June and July were revised upward to a gain of 27,000 as average hourly earnings in the sector rose to $36.92.
Manufacturing activity expands for eighth consecutive month in August: The ISM Manufacturing® PMI expanded at a slower pace in August, decreasing to 54.6% from 55.6% in July. New orders and output expanded at a slower pace as the New Export Orders Index continued its expansion at a faster pace. Meanwhile, the Prices Index was unchanged at 71.1% after declining in July.
What it means: Demand indicators remained positive despite a slowing in overall expansion. Further, production and new orders have expanded for 10 and eight consecutive months, respectively. At the same time, the employment index decreased 1.6 percentage points but remained in expansion for the second consecutive month.
Manufacturing job openings rise in July: Job openings for manufacturing increased by 79,000 to 580,000 in July. The manufacturing job openings rate climbed to 4.4% from 3.8% in June and 3.3% the previous year. Meanwhile, the hires rate for manufacturing stepped down 0.3 percentage points to 2.3%, while the separations rate, which includes quits, layoffs, discharges and other separations, edged down 0.1 percentage point to 2.3% in July.
What it shows: Alongside the growth in manufacturing job openings, job openings in June were revised upward from the previous report. The larger economy, coming in below expectations, saw a gain of 89,000 from June. Overall, the quit and layoff rates continue to remain lower for manufacturing than the broader economy.
Texas manufacturing expansion accelerates as the outlook strengthens: In August, Texas factory activity expanded at a faster pace after strengthening the prior month. The production index increased from 10.1 to 16.1, while the new orders index climbed 15.6 points to 22.0. Meanwhile, the shipments index moved up 5.3 points to 14.1, remaining above the series average of 7.8.
What to look for: In line with expansion, perceptions of business conditions and the company outlook both rose in August, increasing 10.3 points and 5.8 points, respectively. At the same time, wage pressures eased as the index for wages and benefits fell 9.7 points to 21.1, moving in line with the series average. Looking forward, the future company outlook index rose 6.6 points to 35.3, remaining well above the series average of 18.4.
Global manufacturing expands as growth picks up: In August, growth in global manufacturing ticked up from 52.1 to 52.3. Output and new orders both grew at faster paces than in July. At the same time, lead times lengthened, but the rate of growth eased to the lowest level since March.
Why it matters: Recent gains in output have led to increased employment, which rose at the quickest pace in three years in August. Moreover, business optimism climbed to its highest level since February after recent lows.
Factory orders rise in July: New orders for manufactured goods increased 0.9% in July after inching down 0.2% in June. When excluding transportation, new orders moved up 0.6% over the month. At the same time, orders for durable goods rose 1.1% and advanced 7.6% from the year prior.
What it means: Over the year, new orders for manufactured goods climbed 6.5%, led by mining, oil field and gas field machinery (up 39.7%). Further, industrial machinery continues to see strong gains, with orders rising 39.5% from July 2025. At the same time, nondefense aircraft and parts exhibited the largest monthly gain (up 12.7%) but is down 21.8% over the year.
This Week’s Economic Indicators
Monday, Sept. 7 None
Tuesday, Sept. 8 NFIB Small Business Survey Consumer Credit
Wednesday, Sept. 9 None
Thursday, Sept. 10 Producer Price Index Wholesale Trade Existing Home Sales
Friday, Sept. 11 Consumer Price Index Real Earnings University of Michigan Consumer Sentiment Survey (Preliminary)
Deeper Dive
Employment Report: Nonfarm payroll employment increased by 162,000 in August, coming in above expectations. Meanwhile, June’s job gain was revised upward by 11,000 to 31,000 jobs, while July’s job loss was revised upward by 44,000 to a gain of 21,000 jobs. The 12-month average stands at 50,250 job gains per month. Leisure and hospitality exhibited the largest rise, gaining 62,000 jobs in August. At the same time, the unemployment rate was unchanged at 4.1%, while the labor force participation rate ticked up 0.2% to 61.6% but is down from 62.3% in August 2025.
Manufacturing employment added 16,000 jobs in August after gaining 14,000 in July. At the same time, the collective job gains in June and July of 16,000 were revised upward by 11,000 jobs to a gain of 27,000. Manufacturing employment is up 23,000 jobs over the year. Durable goods manufacturing employment rose by 15,000 in August, while nondurable goods employment ticked up by 1,000. The most significant gain in manufacturing in August occurred in machinery manufacturing, which added 6,100 jobs over the month. Meanwhile, the most significant loss occurred in motor vehicle and parts manufacturing, which shed 4,500 jobs over the month.
ISM Manufacturing® Index: In August, the U.S. manufacturing sector expanded for the eighth consecutive month but at a slightly slower pace, with the ISM Manufacturing® PMI edging down 1.0 percentage point to 54.6%. Certain demand indicators, such as the New Orders, Backlog of Orders and New Export Orders indices, were in expansion, while the Customers’ Inventories Index remained in “too low” territory and contracted at a slower pace, stepping up 2.1 percentage points to 42.8.
Job Openings and Labor Turnover Survey: Job openings for manufacturing increased by 79,000 to 580,000 in July. At the same time, the June job openings level of 501,000 was revised upward from 481,000 in the previous report. Durable goods openings in July jumped 76,000 to 429,000, while nondurable goods openings ticked up 2,000 to 151,000. The manufacturing job openings rate rose to 4.4% from 3.8% in June and 3.3% the previous year. The rate for durable goods manufacturing advanced 0.9 percentage points to 5.2%, and the nondurable goods manufacturing rate edged up 0.1 percentage point to 3.1%.
In the larger economy, the number of job openings rose to 7.3 million, a gain of 89,000 from June and 182,000 higher than the previous year. The job openings rate ticked up to 4.4% from 4.3% in June and 4.3% in July 2025. This data reflects an overall labor market that has eased back to pre-pandemic levels but continues to remain relatively tight from a historical perspective.
Texas Manufacturing Outlook Survey: In August, Texas factory activity expanded at a faster pace after strengthening the prior month. The production index increased from 10.1 to 16.1, remaining above the series average of 9.6. The new orders and capacity utilization indices both climbed above their series averages, rising from 6.4 to 22.0 and from 5.9 to 12.8, respectively. Meanwhile, the shipments index moved up 5.3 points to 14.1, remaining above the series average of 7.8. The Eleventh District consists of all of Texas, Louisiana and southern New Mexico.
J.P. Morgan Global Manufacturing PMI: In August, growth in global manufacturing strengthened slightly from July, ticking up from 52.1 to 52.3. Output and new orders both improved at faster paces than the prior month. Meanwhile, lead times lengthened, but the rate of increase eased to the lowest level since March. Employment rose at the quickest pace in three years while stock purchases grew.
Factory Orders: New orders for manufactured goods increased 0.9% in July after inching down 0.2% in June. Meanwhile, new orders for manufactured goods rose 6.5% over the year. When excluding transportation, new orders moved up 0.6% over the month and climbed 6.9% year-over-year in July. Orders for durable goods stepped up 1.1%, after rising 0.6% in June. Year to date, durable goods orders advanced 7.6%. Meanwhile, nondurable goods orders grew 5.3% over the year.
S&P Global U.S. Manufacturing PMI: The S&P Global Manufacturing PMI was 53.9 in August, unchanged from July. Production rose at the weakest rate since February, while new orders continued to grow at a pace similar to July. At the same time, employment rose at the fastest pace of the year as optimism increased to a three-month high.
Productivity and Costs (Revised): In Q2 2026, U.S. nonfarm business labor productivity increased 1.4% in the revised estimate, unchanged from the first estimate, with output up 1.7% and hours worked 0.3% higher. Looking back, productivity has grown 2.2% from Q2 2025. Unit labor costs rose 1.2% due to the rise in labor productivity and a 2.6% increase in hourly compensation. Real hourly compensation fell 3.3% in Q2 but edged down just 0.1% over the year.
Meanwhile, manufacturing productivity advanced 2.4% in Q2 in the revised estimate, up from 1.9% in the preliminary estimate, reflecting a 5.4% rise in output and a 2.9% gain in hours worked. Durable goods productivity increased 3.6%, up from 2.7% in the first estimate, while nondurable productivity stepped up 2.1%, up from a 2.0% gain in the first estimate. Manufacturing unit labor costs ticked down 0.3% in Q2 but rose 3.4% over the year.
International Trade: In July, U.S. exports totaled $310.7 billion—a $6.6 billion decrease from June—while imports were $399.3 billion, up $10.8 billion from the prior month. This resulted in a goods and services deficit of $88.6 billion, up $17.4 billion from June. The increase in the goods and services deficit was driven by a $17.6 billion rise in the goods deficit to $119.6 billion and a $0.2 billion uptick in the services surplus to $31.0 billion. Overall, the goods and services deficit fell $188.4 billion year-over-year.
Goods exports decreased $6.2 billion in July, with the most significant drop being in industrial supplies and materials (down $8.7 billion), led by exports of crude oil falling $4.5 billion. At the same time, exports of capital goods and consumer goods rose $1.9 billion and $1.7 billion, respectively. Goods imports increased $11.4 billion in July, driven by a $14.4 billion rise in capital goods that included a $6.9 billion jump in computers. Service exports decreased $0.4 billion with the loss led by travel services (down $0.6 billion), while service imports declined $0.6 billion, led by charges for the use of intellectual property (down $0.5 billion).
Construction Spending: Total construction spending declined 0.5% in July and 3.8% over the year. Residential construction stepped down 1.3%, while nonresidential construction edged up 0.1% over the month. Private construction spending decreased 0.5% in July and 5.5% over the year. Private manufacturing construction spending dropped 0.8% over the month and 21.7% over the year.