If you’re having trouble reading this, click here.
MONDAY ECONOMIC REPORT
Manufacturers Feel Disproportionate Weight of Price Increases
September 14, 2026
By Victoria Bloom and Michael Green
Manufacturing-Focused Weekly Toplines
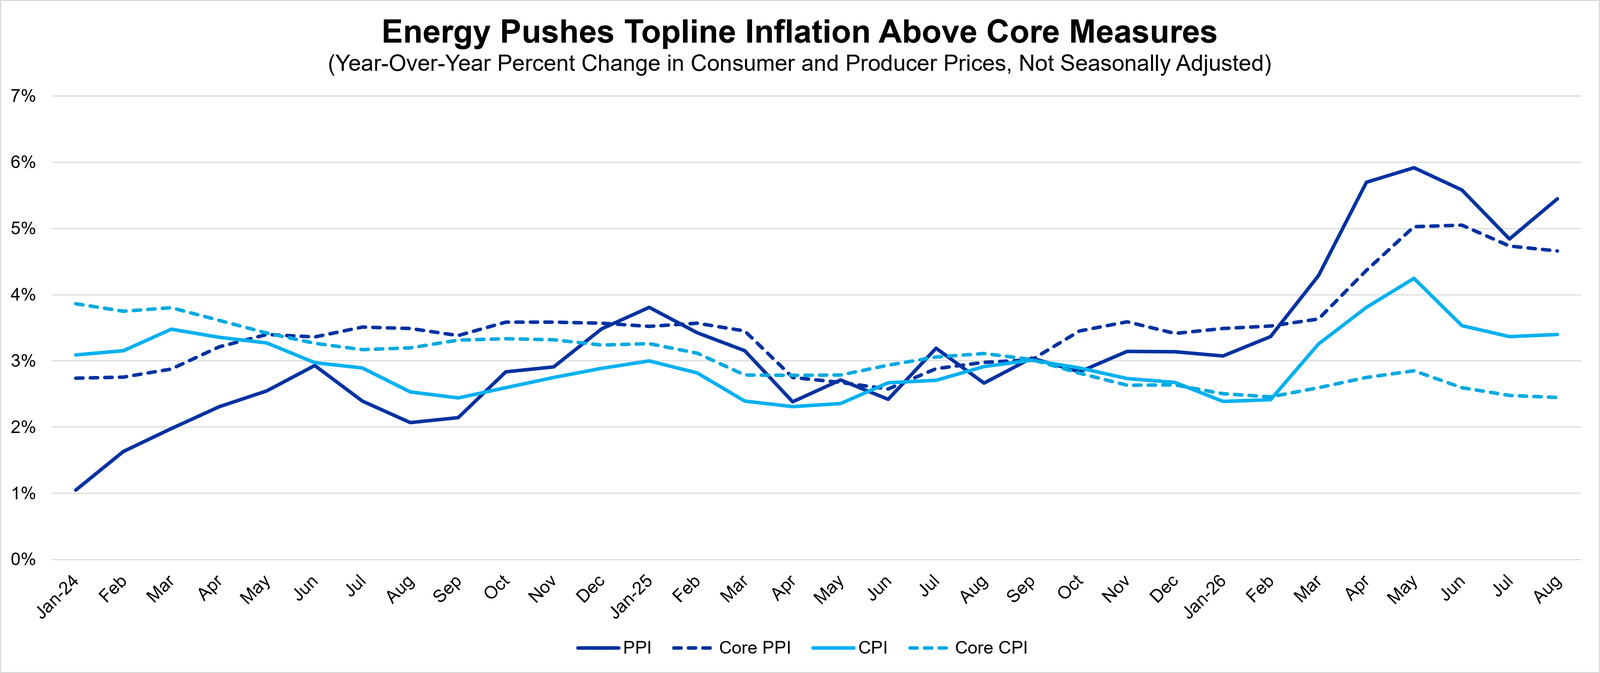
Consumer price growth remains consistent in August: In August, consumer prices increased 0.4% from July and 3.4% over the year, in line with the 3.4% annual rise in July and consistent with expectations. Core CPI, which excludes more volatile energy and food prices, rose 0.3% from July and 2.4% over the year, up from the 0.2% over-the-month increase in July but down slightly from the 2.5% 12-month increase the month prior.
What it means: Consumer prices remain elevated, driven largely by higher energy costs, although underlying price pressures have begun to moderate. Nonetheless, core prices rose slightly more than expected in August and remain well above the Federal Reserve’s 2% target, heightening the chance that the Federal Open Market Committee will raise its target interest rate at its meeting this week.
Meanwhile, producer prices continue to soar: Wholesale prices, which tend to give an early look at where consumer prices are heading, rose 0.4% in August, up from the 0.1% uptick in July. Over the year, producer prices surged 5.4%, up from the 4.8% gain in July. Prices for services inched up 0.1% in August, while prices for goods grew 1.1%. Prices for final demand excluding foods, energy and trade services climbed 4.7% from August 2025, consistent with the increase seen in July.
Why it matters: Energy prices continue to drive the increase in the headline consumer price index, but producers are feeling price pains more broadly and acutely, partly due to energy affecting the price of transportation services and a wide range of commodities that producers utilize. Overall, energy prices rose 4.2% in August as diesel fuel prices surged 24.1%. At the same time, increased demand for certain goods, such as electronic components and accessories, is driving up prices in other areas.
This Week’s Economic Indicators
Monday, Sept. 14 None
Tuesday, Sept. 15 Empire State Manufacturing Survey
Wednesday, Sept. 16 U.S. Import and Export Price Indexes NAHB Housing Market Index Manufacturing Inventories and Sales FOMC Statement
Thursday, Sept. 17 Philadelphia Fed Manufacturing Business Outlook Survey Pending Home Sales New Residential Construction
Friday, Sept. 18 Industrial Production and Capacity Utilization
Deeper Dive
Consumer Price Index: In August, consumer prices increased 0.4% from July and 3.4% over the year, in line with the 3.4% annual rise in July and consistent with expectations. Core CPI, which excludes more volatile energy and food prices, rose 0.3% from July and 2.4% over the year, down slightly from the 2.5% 12-month increase the month prior.
Producer Price Index: The Producer Price Index for final demand (also known as wholesale prices) rose 0.4% in August, up from the 0.1% uptick in July. Over the year, producer prices increased 5.4%, up from the 4.8% gain in July. Meanwhile, prices for final demand excluding foods, energy and trade services climbed 4.7% from August 2025, consistent with the increase seen in July.
NFIB Small Business Survey: The NFIB Small Business Optimism Index decreased 1.1 points to 98.7 in August, remaining slightly above the 52-year average of 98. August’s loss was led by a decline in expected business conditions. Of the 10 components in the index, two increased, while six decreased and two stayed the same. Meanwhile, the Uncertainty Index fell 2 points to 89, still well above the 51-year average (68) and above the average since 2016 (80).
Consumer Credit: Consumer credit climbed 4.2% in July and 2.9% (seasonally adjusted annual rate) in Q2 after increasing 3.4% in June. Revolving credit, which includes credit cards, rose 2.5% after jumping 6.0% in June. Revolving credit rose 4.9% across Q2, up from 4.2% in Q1. Meanwhile, nonrevolving credit, such as car and student loans, increased 4.8% in July, up from the 2.5% gain in June. Nonrevolving credit grew 2.2% in Q2, up slightly from 2.0% in Q1.
After a short dip in May after Americans received their tax refunds, revolving credit usage is ticking up again as prices for a broad range of goods have risen in recent months. At the same time, July saw major changes to popular federal repayment plans, potentially leading to higher payments for borrowers going forward. Overall, consumer credit in July increased at a faster pace than in 2025, when consumer credit rose 2.2% over the year.
Real Earnings: Real average hourly earnings decreased 0.1% in August as a result of a 0.3% rise in average hourly earnings combined with a 0.4% uptick in inflation. Meanwhile, real average weekly earnings increased 0.2% due to the change in real average hourly earnings combined with a 0.3% gain in the average workweek in August. In the past year, real average hourly earnings declined 0.3%, while the average workweek stepped up 0.6%, resulting in a 0.3% rise in real average weekly earnings compared to August 2025.
For production and nonsupervisory employees, real average hourly earnings edged down 0.1% in August as a result of a 0.3% increase in average hourly earnings and a 0.5% rise in inflation. Real average weekly earnings for this group decreased 0.1% due to the change in average hourly earnings and no change in the average workweek. In the past year, real average hourly earnings for this group declined 0.1%, and the average workweek rose 0.3%, resulting in a 0.1% uptick in real average weekly earnings from August 2025.
Existing Home Sales: Existing home sales decreased 2.0% in August and 1.2% over the year. Housing inventory moved up to 1.62 million units, rising 3.2% from July and 5.9% from last year. The median existing home price was $429,100, up 1.6% from last year. In August, the Northeast, Midwest and South experienced declines, while the West stayed the same.
Single-family home sales decreased 1.9% from July and 1.1% from August 2025, with the median price growing 1.7% from last year to $434,800. Condo and co-op sales fell 2.7% from July and 2.7% from last year to 360,000 units in August. Meanwhile, the median price for condos and co-ops advanced 1.5% from the prior year to $371,600.
Homes were typically on the market for 31 days in August, up from 29 days in July but unchanged from 31 days in August 2025. First-time buyers made up 30% of sales in August, up from 29% in July and 28% in August 2025.
University of Michigan Consumer Sentiment Index (Preliminary): In September, consumer sentiment fell 7.5% to an index reading of 47.8 after decreasing 6.3% the prior month. Current economic conditions decreased 1.9%, while the expectations index plummeted 11.1%. The loss in sentiment was led by a sizable decline in year-ahead expectations for both personal finances and business conditions.
Year-ahead inflation expectations jumped from 4.0% in August to 4.6% in September. At the same time, long-run inflation expectations ticked up from 3.3% to 3.4%. Consumers expressed concern about anticipated pressure on their pocketbooks with a resurgence in fuel prices and trade tensions. Nonetheless, five-year expected business conditions remained stable and below the historical average, suggesting the long-run outlook has not worsened due to recent emerging risks.
Wholesale Trade: In July, merchant wholesalers’ sales, excluding manufacturers’ sales branches and offices, increased 0.8% from June and 13.0% from July 2025. The May to June 2026 growth was revised up from an initial estimate of down 3.0% to down 2.9%. Durable goods sales jumped 1.1% in July and 16.9% from July 2025, while nondurable goods sales rose 0.5% in July and 9.4% year-over-year.
Total inventories for wholesalers moved up 1.3% in July and 5.7% from July 2025. Durable goods inventories increased 1.1% in July and 5.3% year-over-year. At the same time, nondurable goods inventories stepped up 1.6% in July and 6.5% year-over-year. The overall inventories-to-sales ratio was 1.20 in July, up slightly from 1.19 in June but down from 1.28 in July 2025. Durable goods had a 1.48 inventory-to-sales ratio, while the ratio for nondurable goods was 0.91.