If you’re having trouble reading this, click here.
MONDAY ECONOMIC REPORT
Federal Reserve Pivots as Inflation Proves Stubborn
September 21, 2026
By Victoria Bloom and Michael Green
Manufacturing-Focused Weekly Toplines
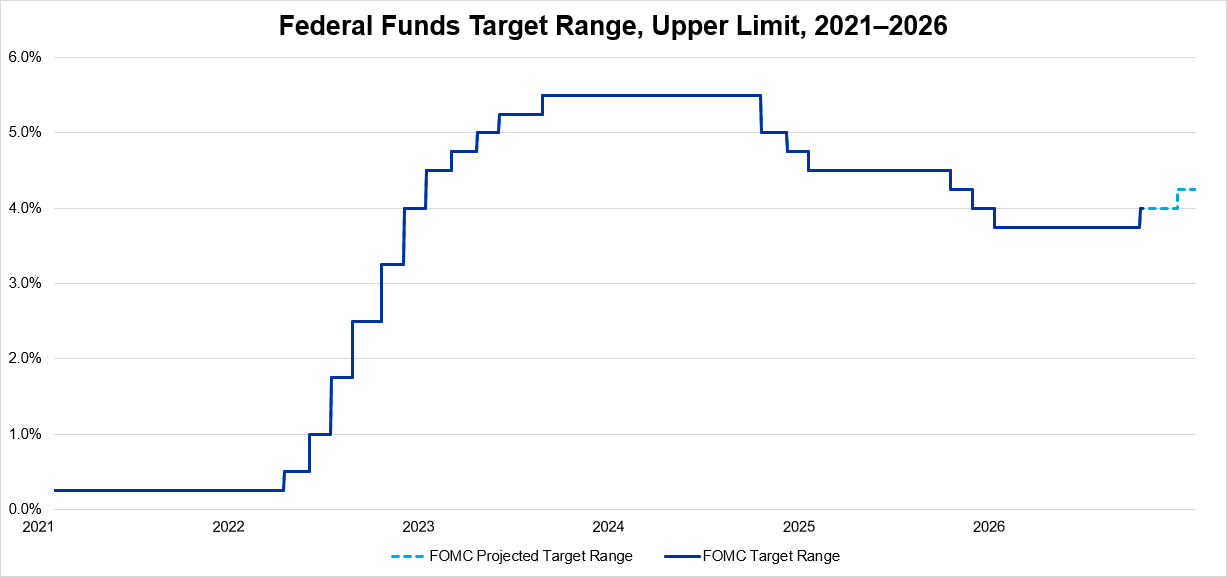
The Federal Reserve hiked rates for the first time in three years: As anticipated, the Federal Open Market Committee raised its interest rate target range by 25 basis points to 3.75%–4.00% at its September meeting, the first hike since July 2023. The interest rate decision was unanimous. Federal Reserve Chairman Kevin Warsh reaffirmed that he would be hard-pressed to describe broad financial conditions as restrictive and that this view was shared broadly by the committee. Furthermore, the FOMC noted that the action would support a timelier return to the committee’s 2% goal.
Why it matters: Although manufacturers are sensitive to higher borrowing costs, increased raw material costs ranked as the greatest business challenge in the NAM’s Q3 Manufacturers’ Outlook Survey for a second consecutive quarter, highlighting the pain inflation has inflicted on the industry. That said, since 16 of the 18 FOMC officials forecasted at least one additional rate hike by the end of 2026 in its summary of economic projections, markets are anticipating another rate hike at the October meeting.
Import and export costs keep rising: In August, U.S. import prices for manufacturing climbed 5.9% over the year, with nearly all subsectors of the industry experiencing price increases. Petroleum and coal products manufacturing experienced the most significant over-the-year U.S. import price increase in August, surging 42.2%. On the other hand, U.S. import prices for electrical equipment, appliance and component manufacturing stayed the same from August 2025. Meanwhile, U.S. export prices for manufacturing advanced 7.4% over the year, with petroleum and coal products manufacturing exhibiting the largest rise (38.1%).
What it means: Increased import prices were relatively widespread in August, but over-the-year fuel import price increases remain outsized compared to other categories amid the conflict in the Middle East. As the conflict continues, import and export prices are expected to remain elevated.
Manufacturing production stumbles in August: Manufacturing output decreased 0.3%, the first monthly decline of 2026. At the same time, manufacturing production was up 0.9% from the year prior. Capacity utilization for manufacturing was 75.7%, down 0.3 percentage points from July but up 1.0% over the past year. Capacity utilization for manufacturing remained 2.5 percentage points below its long-run average from 1972 to 2025.
Why it matters: After output growth proved steady through the beginning of 2026, manufacturing production pulled back, with a majority of industry groups exhibiting declines. Nonetheless, one data point does not make a trend, and other demand indicators in the industry remain strong. That said, nondurable manufacturing remains weaker than durable manufacturing over the year.
Manufacturing activity in Philadelphia and New York slowed as prices rose: Philadelphia’s regional manufacturing activity expanded at a slower pace in September, with the index for general business activity falling from 47.4 to 37.8. The prices paid and prices received indices in Philadelphia both rose in September, moving from 40.9 to 48.6 and from 17.7 to 31.3, respectively. Meanwhile, manufacturing activity in New York state also expanded at a slower pace in September, with the headline business conditions index declining 13.0 points to 7.6. At the same time, the prices paid and prices received indices in New York both grew, stepping up from 58.6 to 63.1 and from 22.7 to 28.1, respectively.
What it means: As price pressures intensified, current activity and future growth indicators weakened in Philadelphia and New York. Nonetheless, manufacturers remained relatively optimistic, with expectations for future business activity remaining positive in both regions, indicating manufacturers anticipate demand to continue to be resilient despite inflation.
This Week’s Economic Indicators
Monday, Sept. 21 None
Tuesday, Sept. 22 Richmond Fed Survey of Manufacturing Activity
Wednesday, Sept. 23 S&P Global Flash PMI
Thursday, Sept. 24 Kansas City Fed Manufacturing Survey New Home Sales
Friday, Sept. 25 University of Michigan Consumer Sentiment Index Durable Goods (Advance)
Deeper Dive
FOMC Statement: As anticipated, the Federal Open Market Committee raised its interest rate target range by 25 basis points to 3.75%–4.00% at its September meeting, the first hike since July 2023. The interest rate decision was unanimous. In a change to its previous statement, the FOMC noted that the action would support a timelier return to the committee’s 2% goal.
U.S. Import and Export Price Indexes: U.S. import prices increased 0.7% in August, after declining 0.3% in July, with higher prices for nonfuel imports more than offsetting lower prices for fuel imports. Over the year, import prices advanced 7.0%, the largest annual increase since August 2022. Meanwhile, U.S. export prices rose 0.6% in August, driven by higher prices for both agricultural and nonagricultural exports. Over the past year, export prices jumped 8.6%.
In August, U.S. import prices for manufacturing climbed 5.9% over the year, with nearly all subsectors of the industry experiencing price increases. Petroleum and coal products manufacturing experienced the most significant over-the-year U.S. import price increase in August, surging 42.2%. On the other hand, U.S. import prices for electrical equipment, appliance and component manufacturing stayed the same from August 2025. Meanwhile, U.S. export prices for manufacturing advanced 7.4% over the year, with petroleum and coal products manufacturing exhibiting the largest rise (38.1%).
Industrial Production and Capacity Utilization: Industrial production stayed the same in August, while manufacturing output decreased 0.3% after ticking up 0.2% in July. At 98.2% of its 2017 average, manufacturing production increased 0.9% from August 2025. Capacity utilization for manufacturing was 75.7%, down 0.3 percentage points from July but up 1.0% over the past year. Capacity utilization for manufacturing remained 2.5 percentage points below its long-run average from 1972 to 2025.
Philadelphia Fed Manufacturing Business Outlook Survey: In September, Philadelphia’s regional manufacturing activity expanded at a slower pace, with the index for general business activity falling from 47.4 to 37.8. This month, 45.3% of firms reported increases in activity, while 7.5% cited decreases. New order growth also slowed, moving down from 30.1 to 29.2, while the shipments index stayed the same at 27.7. Meanwhile, the employment index dropped 16.1 points to 11.8, and the average employee workweek index stepped down 8.5 points to 18.0. The prices paid and prices received indices both rose in September, moving from 40.9 to 48.6 and from 17.7 to 31.3, respectively. As has been the case for many months, the prices received index remained lower than the prices paid index, indicating that manufacturers have been absorbing a portion of higher costs paid.
Empire State Manufacturing Survey: Manufacturing activity in New York state expanded at a slower pace in September, with the headline business conditions index declining 13.0 points to 7.6. The new orders index fell 15.3 points to 2.0, while the shipments index turned negative, decreasing 14.9 points to -3.2. The unfilled orders index dropped 9.6 points to 5.9, while inventories jumped 14.1 points to 8.9. Delivery times lengthened and supply availability worsened, but both at slower paces.
New Residential Construction: Building permits decreased 2.7% in August but rose 3.5% over the year. Permits for single-family homes in August declined 1.8% but increased 1.3% over the year. At the same time, permits for buildings with five or more units fell 3.1% from July but jumped 9.4% over the year.
Pending Home Sales: In August, pending home sales ticked up 0.3% over the month but fell 4.7% over the year, with two regions reporting gains and two experiencing declines. The Pending Home Sales Index, which predicts home sales through contract signings, increased to 71.2 in August, up from 71.0 in July.
Breaking it down by region, the Northeast decreased 4.2% over the month and 3.9% over the year. The Midwest moved down 1.6% over the month and 4.9% over the year. Meanwhile, the South rose 2.3% month-over-month but fell 3.8% year-over-year. The West increased 3.0% over the month but dropped 6.7% from August 2025.
Home sales remain below 2025 and pre-pandemic levels despite an uptick in August. Moreover, elevated mortgage rates continue to offset the buying power that job gains and income growth would otherwise provide.
NAHB Housing Market Index: Builder confidence in the market for new single-family homes was 32 in September, down 3 points from August. One component of the Housing Market Index stayed the same in September, while two components declined. Present sales conditions fell 4 points to 35, while expected sales in the next six months stepped down 6 points to 37. At the same time, traffic of prospective buyers remained at 23. The share of builders cutting prices was 38% in September, up from 35% in August. Meanwhile, the average price reduction was 6%, unchanged from August.
Manufacturing Inventories and Sales: In July, manufacturers’ sales rose 0.8% from June and 8.3% from July 2025. Manufacturers’ inventories stepped up 0.4% in July and 2.0% from the same month a year ago. The manufacturers’ inventories/sales ratio stood at 1.47 at the end of July, unchanged from the prior month but down from 1.56 recorded in July 2025.