If you’re having trouble reading this, click here.
MONDAY ECONOMIC REPORT
Early Indicators Suggest Manufacturing Growth Continues in September
September 28, 2026
By Victoria Bloom and Michael Green
Manufacturing-Focused Weekly Toplines
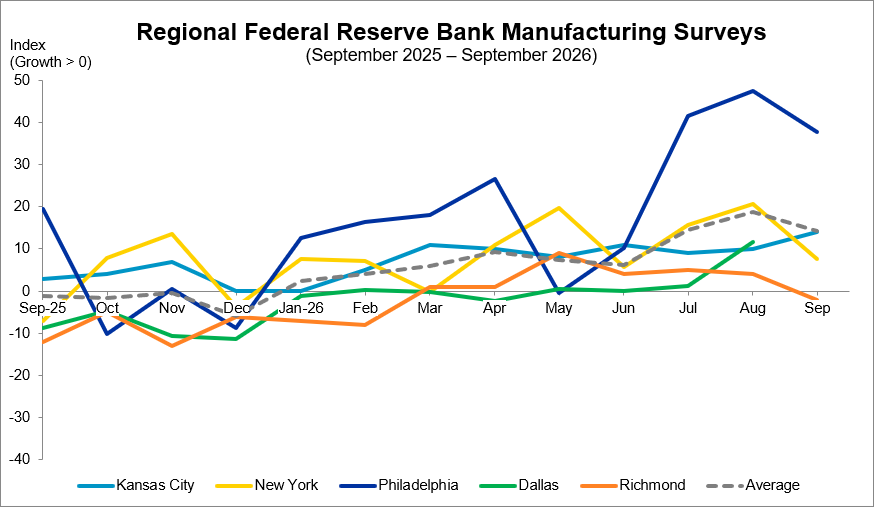
Kansas City manufacturing activity picks up in September: The month-over-month composite index in the Tenth District rose to 14 from 10 in August, while expectations for future activity edged down from 20 to 19. The production index increased from 17 to 20, and the shipments index stepped up from 17 to 21. Meanwhile, new orders jumped from 16 to 24, while the employment index stayed the same at 0.
What it means: No indices in Kansas City were negative in September, indicating broad growth from the prior month. Furthermore, activity in the region continues to show positive signs for the future. That said, continued pressure on input prices could erode the current level of growth.
On the other hand, manufacturing activity turned slightly negative in Richmond: The composite manufacturing index declined from 4 to -2 in September. Shipments and new orders decreased, falling from 11 to -5 and from 3 to -6, respectively. At the same time, local business conditions also contracted, falling from 4 to -6 in September.
Why it matters: In line with a slowing in business conditions, manufacturers are still optimistic about the future, but less so than the prior month, with the outlook for future local business conditions weakening from 16 to 10 but remaining positive. At the same time, expectations for future shipments rose from 26 to 33, while expectations for new orders stayed the same at 32, indicating that manufacturers in Richmond believe the downturn will be short-lived.
Flash PMI signals faster expansion in manufacturing activity: The S&P Global Flash U.S. Manufacturing PMI rose from 53.9 to 57.0 in September, a 52-month high. Factory production accelerated at its quickest pace since April 2022, while new order growth hit a more than four-year high. Inventories increased in September, while supplier delivery times lengthened to the greatest degree since July 2022 as supplier delays became more widespread. Overall, price pressures worsened in September, led by higher fuel and transportation costs, alongside some mentions of wage pressures.
What it means: While the Flash PMI is only an early estimate of manufacturing activity based on 85% of responses, it can give an indication of where activity is trending. The Flash PMI finds output growth in both manufacturing and services is booming in September, with the improvement in activity being the greatest since 2015, barring the spike following the pandemic. Although supply chain bottlenecks are severe and inflationary pressures persist, neither seems to be dampening business activity.
This Week’s Economic Indicators
Monday, Sept. 28 Texas Manufacturing Outlook Survey
Tuesday, Sept. 29 S&P Cotality Case-Shiller Home Price Index Conference Board Consumer Confidence Job Openings and Labor Turnover Survey
Wednesday, Sept. 30 Personal Income and Outlays GDP (Q2 2026 Third Estimate) Corporate Profits
Thursday, Oct. 1 ISM Manufacturing Index JP Morgan Global Manufacturing PMI S&P Global U.S. Manufacturing PMI Construction Spending
Friday, Oct. 2 Employment Report Factory Orders
Deeper Dive
Kansas City Fed Manufacturing Survey: Manufacturing activity grew at a faster pace in the Tenth District in September, with the month-over-month composite index rising to 14 from 10 in August. Meanwhile, expectations for future activity edged down from 20 to 19. The month-over-month increase in activity was led by gains in plastics and rubber products and furniture manufacturing. Further, no indices were negative in September, indicating broad growth from the prior month. The Tenth Federal Reserve District encompasses the western third of Missouri; all of Kansas, Colorado, Nebraska, Oklahoma and Wyoming; and the northern half of New Mexico.
Richmond Fed Survey of Manufacturing Activity: Manufacturing activity in the Fifth District turned negative in September after slowing in August, with the composite manufacturing index declining from 4 to -2. At the same time, local business conditions also contracted, falling from 4 to -6 in September. In line with a slowing in business conditions, manufacturers are less optimistic about the future, with the outlook for future local business conditions weakening from 16 to 10. The Fifth District consists of Virginia, Maryland, the Carolinas, the District of Columbia and most of West Virginia.
S&P Global Flash U.S. Manufacturing PMI: The S&P Global Flash U.S. Manufacturing PMI rose from 53.9 to 57.0 in September, a 52-month high. Factory production accelerated at its quickest pace since April 2022, while new order growth hit a more than four-year high. Meanwhile, manufacturing employment rose at its fastest rate since February 2021.
University of Michigan Consumer Sentiment Index: In September, consumer sentiment fell 7.0% to an index reading of 48.1, after declining 6.3% the prior month. Current economic conditions stepped down 1.9%, while the expectations index plunged 10.1%. The short-run outlook for business conditions deteriorated due to concerns that escalating trade disputes and elevated fuel prices would impact the economy negatively. That said, buying conditions for durable goods improved slightly, in part as consumers sought to avoid higher prices later. Overall, consumer sentiment is down 15% from January 2026.
Year-ahead inflation expectations rose from 4.0% in August to 4.6% in September, the highest reading since June. Meanwhile, long-run inflation expectations ticked up from 3.3% to 3.4%, slightly higher than the range seen in 2024. Moreover, respondents’ views of current and expected personal finances weakened about 10% this month as concerns over prices continued to climb.
Durable Goods (Advance): New orders for manufactured durable goods edged down less than 0.1% in August, or $0.1 billion, to $338.6 billion, following a 0.9% gain the prior month. Meanwhile, new orders for manufactured durable goods climbed 7.7% over the year. Transportation equipment led the decline, decreasing 0.6% over the month, with nondefense aircraft and parts falling 4.3% in August. Excluding transportation, new orders increased 0.3% over the month and 9.6% over the year.
New Residential Sales: New single-family home sales rose 6.4% in August but fell 2.0% over the year. The median sales price for new homes sold in August was $393,700, up 0.4% from July but down 5.8% from August 2025. At the same time, the average sales price was $478,700, down 9.1% from July and 8.8% from a year earlier. New housing inventory stayed the same at 483,000 units but was down 2.0% from last year. This represents a supply of 8.5 months at the current sales pace, down 5.6% from 9.0 months in July.
NAM Quarterly Economic Update and Manufacturing Outlook Webinar
Join NAM Chief Economist Victoria Bloom on Thursday, October 8, at 2:00 p.m. EDT as she discusses the results from the NAM’s Q3 2026 Manufacturers’ Outlook Survey as well as a review of economic indicators from the third quarter and a look ahead to the fourth quarter. Learn more and register here.