If you’re having trouble reading this, click here.
MONDAY ECONOMIC REPORT
Manufacturing Expansion Drives Payroll Growth
October 05, 2026
By Victoria Bloom and Michael Green
Manufacturing-Focused Weekly Toplines
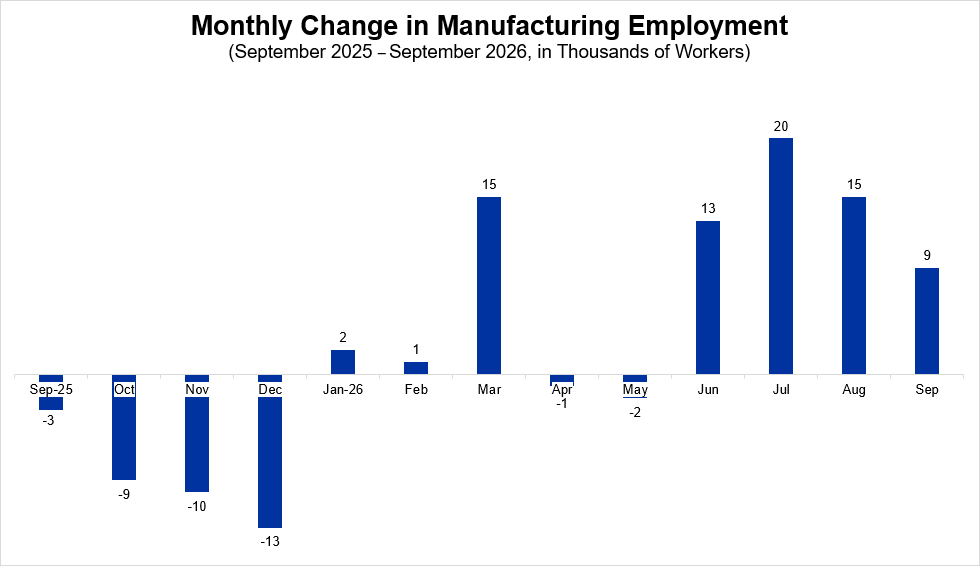
Manufacturing employment rises again in September: Manufacturing employment advanced by 9,000 in September after increasing by 15,000 in August. Meanwhile, nonfarm payroll employment increased by just 29,000 in September, coming in below expectations. At the same time, the unemployment rate ticked up 0.1 percentage point from August to 4.2%, while the labor force participation rate rose 0.2 percentage points to 61.8% but is down from 62.5% in September 2025.
What it means: Although nonfarm job gains remain weak over the year, averaging just 41,000 job gains per month over the past 12 months, the “breakeven” level of job gains necessary to keep the unemployment rate steady has fallen dramatically in the past two years due to the steep drop in immigration. The “breakeven” level of job gains is now estimated to be less than 85,000 job gains per month compared to the more than 150,000 job gains needed per month prior to the immigration crackdown. Therefore, the labor market can remain healthy despite relatively weak jobs reports.
Manufacturing activity continued to expand in September: The ISM Manufacturing® PMI expanded for the ninth consecutive month and at roughly the same pace as the prior month, edging down to 54.5% from 54.6% in August. Demand indicators, such as the New Orders, Backlog of Orders and New Export Orders indices, stayed in expansion territory. The Prices Index jumped 6.8 percentage points in September to 77.9%, indicating raw materials prices grew for the 24th straight month and at a much faster pace than the prior month.
Why it matters: Despite price pressures stemming from tariffs and the conflict in the Middle East, demand indicators remained broadly positive in September. That said, respondents noted that new tariffs against Canada were increasing costs further, while higher interest rates were slowing growth of new construction projects. As the pricing and supply pressures flow through, it could dampen growth in activity in the future.
Strong demand sustains growth in factory orders: New orders for manufactured goods increased 0.1% in August and 6.8% over the year. Excluding transportation, new orders climbed 0.3% over the month and 7.3% year-over-year in August. Meanwhile, machinery orders are up 13.0% over the year, led by a 39.3% surge in industrial machinery.
What it shows: Durable goods orders climbed 7.7% over the year, while nondurable goods orders grew 5.8%, with strength in demand being broad-based across the industry. Amid the surge in new demand, keeping up with the influx of orders remains a problem for manufacturers, with unfilled orders jumping 8.8% year-over-year.
Global manufacturing expansion accelerated despite price pressures: In September, growth in global manufacturing activity strengthened from August, rising from 52.3 to 53.0, a 55-month high. Output and new orders both improved at a faster pace than the prior month, with growth reaching 62-month and 55-month highs, respectively. Meanwhile, lead times lengthened as new export orders increased at the quickest rate in over five years. Input and output price growth accelerated in September amid supply disruptions and higher transport and energy costs.
Why it matters: Global manufacturing activity expanded at the fastest pace since the mid-2021 goods sector boom. Amid faster growth, businesses remained optimistic about their outlook, anticipating output to expand further over the next year. If geopolitical tensions and trade challenges were to abate, the U.S. could better capitalize on the growing demand for goods worldwide.
Other PMI measures also display expanding manufacturing activity: The S&P Global Manufacturing PMI was 55.9 in September, up from 53.9 in August and the highest reading since May 2022. Amid increased domestic demand, production rose at a faster rate, while new orders grew at the quickest pace since April. At the same time, export orders declined, while input prices increased at a steeper rate due to tariffs, higher energy prices and supply shortages.
What it means: Robust domestic demand kept the manufacturing expansion alive, but tariffs negatively hit foreign demand. Further, tariffs and the conflict in the Middle East continued to put pressure on input prices. This trend of growth paired with inflationary pressures is likely to persist as long as demand exceeds supply.
Manufacturing job openings fell in August but remain elevated: Job openings for manufacturing fell by 54,000 to 522,000 in August. The manufacturing job openings rate edged down to 4.0% from 4.4% in July but rose from 3.2% the previous year. Meanwhile, the hires rate for manufacturing climbed to 2.6% from 2.3% in July, while the separations rate, which includes quits, layoffs, discharges and other separations, rose 0.2 percentage points for manufacturing to 2.5%, up slightly from 2.4% the year prior.
What it shows: The pickup in job openings for manufacturing this year has been more pronounced in durable goods sectors, which has also seen a notable increase in their order books and production levels in 2026 compared to nondurable goods sectors. On the other hand, hiring rates have been slightly stronger in nondurable goods sectors, while durable goods sectors appear to be having more trouble filling open positions amid the increased demand for labor.
This Week’s Economic Indicators
Monday, Oct. 5 None
Tuesday, Oct. 6 International Trade
Wednesday, Oct. 7 Consumer Credit
Thursday, Oct. 8 Wholesale Trade
Friday, Oct. 9 University of Michigan Consumer Sentiment Index (Preliminary)
Deeper Dive
Employment Report: Nonfarm payroll employment increased by just 29,000 in September, coming in below expectations. Meanwhile, August’s job gain was revised downward by 29,000 to a gain of 133,000 jobs, while July’s job gain was revised downward by 31,000 to a loss of 10,000 jobs. The 12-month average stands at 41,000 job gains per month. Healthcare and social assistance continues to exhibit the most significant job gains, adding 23,000 jobs in September. At the same time, the unemployment rate ticked up 0.1 percentage point from August to 4.2%, while the labor force participation rate rose 0.2 percentage points to 61.8% but is down from 62.5% in September 2025.
Manufacturing employment advanced by 9,000 in September after increasing by 15,000 in August. In addition, the collective job gains in July and August of 30,000 were revised upward by 5,000 jobs to an increase of 35,000 jobs. Manufacturing employment is up 40,000 over the year and up 72,000 since a recent low in December 2025. Durable goods manufacturing employment climbed by 8,000 in September, while nondurable goods employment inched up by 1,000. The largest manufacturing job gain occurred in plastics and rubber products, which added 4,600 jobs over the month. Meanwhile, the most significant loss occurred in paper manufacturing, which shed 2,600 jobs over the month.
ISM Manufacturing® Index: In September, the U.S. manufacturing sector expanded for the ninth consecutive month and at roughly the same pace, with the ISM Manufacturing® PMI edging down to 54.5% from 54.6% in August. Demand indicators, such as the New Orders, Backlog of Orders and New Export Orders indices, stayed in expansion territory. Meanwhile, the Customers’ Inventories Index remained in “too low” territory and contracted at a faster pace, a positive sign for future production, falling 1.2 percentage points to 41.6%. At the same time, the Production Index expanded at a slower pace in September, dropping from 58.3% to 56.7%.
Factory Orders: New orders for manufactured goods increased 0.1% in August after rising 0.8% in July. Meanwhile, new orders for manufactured goods rose 6.8% over the year. Excluding transportation, new orders climbed 0.3% over the month and 7.3% year-over-year in August. Durable goods orders edged down 0.1% after increasing 0.9% in July. Year to date, durable goods orders advanced 7.7%. Meanwhile, nondurable goods orders grew 5.8% over the year.
J.P. Morgan Global Manufacturing PMI: In September, growth in global manufacturing activity strengthened from August, rising from 52.3 to 53.0, a 55-month high. Output and new orders both improved at a faster pace than the prior month, with growth reaching 62-month and 55-month highs, respectively. Meanwhile, lead times lengthened as new export orders increased at the quickest rate in over five years. Employment expanded for the third consecutive month, and stocks of purchases grew.
S&P Global U.S. Manufacturing PMI: The S&P Global Manufacturing PMI was 55.9 in September, up from 53.9 in August and the highest reading since May 2022. Amid increased domestic demand, production rose at a faster rate, while new orders grew at the quickest pace since April. At the same time, export orders declined, while input prices increased at a steeper rate due to tariffs, higher energy prices and supply shortages.
Job Openings and Labor Turnover Survey: Job openings for manufacturing fell by 54,000 to 522,000 in August. At the same time, the July job openings level of 576,000 was revised downward from 580,000 in the previous report. Nondurable goods job openings in August decreased 11,000 to 142,000, while durable goods job openings moved down 43,000 to 380,000. The manufacturing job openings rate edged down to 4.0% from 4.4% in July but rose from 3.2% the previous year. The rate for nondurable goods manufacturing ticked down 0.2 percentage points to 2.9%, while the rate for durable goods manufacturing fell 0.5 percentage points to 4.6%.
In the larger economy, the number of job openings dropped to 7.1 million, a decline of 256,000 from July but an increase of 160,000 from the previous year. The job openings rate inched down to 4.3% from 4.4% in July but was up from 4.2% in August 2025. This data reflects an overall labor market that has rebounded some from last year’s levels, particularly for manufacturing, and remains relatively tight from a historical perspective.
Texas Manufacturing Outlook Survey: In September, Texas factory activity expanded at a faster pace after strengthening the prior month. The production index increased from 16.1 to 29.5, remaining well above the series average of 9.7. The new orders and capacity utilization indices both strengthened, rising from 22.0 to 30.7 and from 12.8 to 23.9, respectively. At the same time, the shipments index moved up 10.7 points to 24.8, remaining well above the series average of 7.9.
Conference Board Consumer Confidence: Consumer confidence decreased 6.7 points in September to 81.9. Among its components, the Present Situation Index and Expectations Index both contracted as consumers’ views of current conditions and their outlook for the future both worsened.
S&P Cotality Case-Shiller Home Price Index: In July, the S&P Cotality Case-Shiller U.S. National Home Price Index recorded a 1.9% annual gain, up from a 1.6% rise in June. The 10-City Composite increased 3.4% year-over-year, up from a 3.0% gain the previous month, while the 20-City Composite moved up 2.5%, up from 2.2%. Chicago again posted the highest annual gain at 6.9%, followed by New York at 5.8% and Cleveland at 4.2%. Meanwhile, Seattle posted the lowest annual return, with prices falling 1.6%.
PCE Price Index: In August, the PCE price index, the Federal Reserve’s preferred inflation gauge, increased 0.3% over the month and 3.4% over the year, unchanged from the 3.4% year-over-year rise in July. Prices for both goods and services rose 0.3%. Within the goods category, gasoline and other energy goods prices jumped 4.4%, while prices for other durable goods decreased 0.3%. Excluding food and energy, the core PCE price index advanced 0.2% over the month and 3.0% over the year, consistent with the rise seen in July and remaining lower than the overall inflation rate.
Corporate Profits (Q2 2026 Revised Estimate): Economy-wide corporate profits rose 8.9% in the second quarter and 20.8% from Q2 2025. Domestic industry profits surged 9.4% from the previous quarter and 21.5% over the past year. Profits for domestic nonfinancial corporations grew $289.0 billion in the second quarter, up from the $135.6 billion rise in the first quarter. Meanwhile, profits for domestic financial corporations increased $67.4 billion in the second quarter after ticking down $7.1 billion in the prior quarter. Profits from the rest of the world rose 5.3% from the first quarter.
GDP (Q2 2026 Third Estimate): Real GDP in the second quarter of 2026 grew at an annual rate of 2.2%, revised up 0.7 percentage points from the prior estimates. In the first quarter of 2026, real GDP rose 2.5%, revised up 0.4 percentage points from the prior estimate. The update primarily reflected upward revisions to investment, consumer spending and government spending. The increase in GDP in the second quarter reflected increases in investment (up 4.6%), consumer spending (up 3.8%) and exports (up 5.0%). Current-dollar GDP rose 8.5% at an annual rate in the second quarter, reflecting an upward revision of 0.5 percentage points from the prior estimate, while the price index for gross domestic purchases increased 5.6%, revised down 0.2 percentage points from the previous estimate.
Personal Income and Outlays: Personal income increased $66.6 billion, or 0.2% in August. Disposable income, which is personal income after taxes, rose $68.6 billion, or 0.3%. Meanwhile, personal consumption expenditures grew $190.8 billion, or 0.9%. The personal saving rate, which is personal saving as a percentage of disposable income, was 4.1%, down from 4.6% in July and 5.2% in August 2025.
Construction Spending: Total construction spending increased 0.9% in August but declined 1.7% over the year. Residential construction stepped up 1.1%, while nonresidential construction rose 0.7% over the month. Private construction spending moved up 1.1% in August but fell 3.1% over the year. Private manufacturing construction spending stayed the same over the month but dropped 19.8% over the year.
NAM Quarterly Economic Update and Manufacturing Outlook Webinar
Join NAM Chief Economist Victoria Bloom on Thursday, Oct. 8, at 2:00 p.m. EDT as she discusses the results from the NAM’s Q3 2026 Manufacturers’ Outlook Survey as well as a review of economic indicators from the third quarter and a look ahead to the fourth quarter. Learn more and register here.