If you’re having trouble reading this, click here.
MONDAY ECONOMIC REPORT
Trade Deficit Jumps as Capital Goods Imports Reach a Record High
October 13, 2026
By Victoria Bloom and Michael Green
Manufacturing-Focused Weekly Toplines
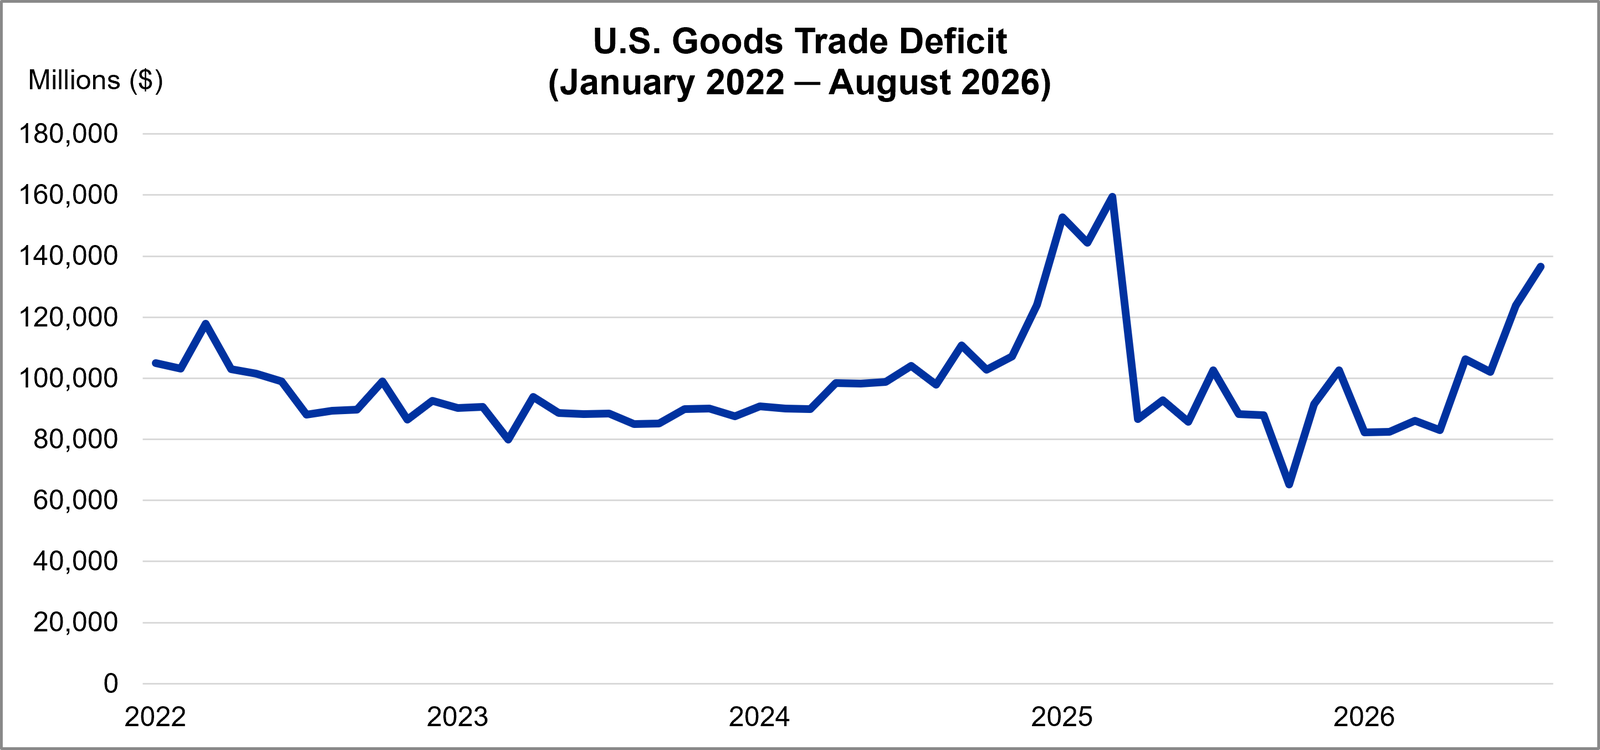
Overall goods trade picked up in August: U.S. exports totaled $315.2 billion in August—a $4.5 billion increase from July—while imports were $420.8 billion, up $17.2 billion from the prior month. This resulted in a goods and services deficit of $105.6 billion, up $12.7 billion from July and near the record highs of early 2025. Goods exports increased $4.4 billion in August, while goods imports rose $17.2 billion.
What it means: Overall, the goods and services deficit surged $48.4 billion from the same month a year prior but declined $138.2 billion year-to-date from the same period in 2025. In August, the most significant monthly import gain came in industrial supplies and materials (up $6.3 billion), while imports of capital goods increased $6.2 billion to a record high. The top import categories in August were computers, computer accessories, semiconductors, crude oil and other telecommunications equipment. At the same time, goods exports remained elevated compared to pre-2025 levels but were well below the record level in April 2026.
Consumer sentiment declined as a result of economic conditions: In October, consumer sentiment declined 3.7% to an index reading of 46.3, after decreasing 7.0% the prior month. Current economic conditions fell 12.2%, while the expectations index rose 2.2%. Year-ahead and long-run inflation expectations ticked up from 4.6% to 4.7% and from 3.4% to 3.5%, respectively. Consumers continued to express concern over prices and borrowing costs, with buying conditions for durables plummeting in October.
Why it matters: As prices and borrowing costs grow, big-ticket purchases that typically require financing, such as homes and autos, are expected to take a hit. In addition, as long as consumers anticipate price hikes, inflation could become a self-fulfilling prophecy. Nevertheless, consumer spending has remained robust in 2026 despite incredibly low sentiment levels.
This Week’s Economic Indicators
Monday, Oct. 12 None
Tuesday, Oct. 13 Existing Home Sales NFIB Small Business Survey
Wednesday, Oct. 14 Consumer Price Index Real Earnings
Thursday, Oct. 15 Empire State Manufacturing Survey Philadelphia Fed Manufacturing Business Outlook Survey Producer Price Index Manufacturing Inventories and Sales
Friday, Oct. 16 U.S. Import and Export Price Indexes Industrial Production and Capacity Utilization
Deeper Dive
International Trade: In August, U.S. exports totaled $315.2 billion—a $4.5 billion increase from July—while imports were $420.8 billion, up $17.2 billion from the prior month. This resulted in a goods and services deficit of $105.6 billion, up $12.7 billion from July. The increase in the goods and services deficit was driven primarily by a $12.8 billion rise in the goods deficit to $136.6 billion. Overall, the goods and services deficit fell $138.2 billion year-over-year. Overall, the goods and services deficit jumped $48.4 billion from the same month a year prior. Meanwhile, the goods and services deficit year-to-date was $138.2 billion lower than the same period in 2025.
Goods exports increased $4.4 billion in August. The most significant gain came in industrial supplies and materials (up $6.3 billion), led by exports of nonmonetary gold rising $2.3 billion. At the same time, exports of capital goods stepped up $1.3 billion, led by exports of semiconductors (up $1.0 billion). Goods imports rose $17.2 billion in August, led by a $9.1 billion jump in industrial supplies and materials that included an increase of $3.3 billion in imports of crude oil. Meanwhile, imports of capital goods increased $6.2 billion to a record high, led by imports of semiconductors (up $2.4 billion). Service exports ticked up less than $0.1 billion with the gain led by charges for the use of intellectual property (up $0.2 billion), while service imports moved up less than $0.1 billion, led by transport services (up $0.4 billion).
University of Michigan Consumer Sentiment Index (Preliminary): In October, consumer sentiment declined 3.7% to an index reading of 46.3, after decreasing 7.0% the prior month. Current economic conditions fell 12.2%, while the expectations index rose 2.2%. A drop in sentiment among independents more than offset increases by both Democrats and Republicans. Despite the loss in sentiment, year-ahead expectations for both personal finances and business conditions increased slightly.
Year-ahead inflation expectations ticked up from 4.6% in September to 4.7% in October, well above the reading of 3.4% in February before the conflict in Iran began. At the same time, long-run inflation expectations inched up from 3.4% to 3.5%, a notable increase from the average range seen in 2024. Consumers continued to express concern over prices and borrowing costs, with buying conditions for durables plummeting in October. Overall, both year-ahead and long-run inflation expectations grew to their highest levels since May.
Consumer Credit: Consumer credit rose 1.9% in August and 3.1% (seasonally adjusted annual rate) in Q2 after climbing 4.1% in July. Revolving credit, which includes credit cards, fell 4.2% after increasing 2.5% in July. Revolving credit advanced 4.9% across Q2, up from 4.2% in Q1. Meanwhile, nonrevolving credit, such as car and student loans, stepped up 4.1% in August, down from the 4.7% gain in July. Nonrevolving credit grew 2.4% in Q2, up from 2.0% in Q1.
Households pulled back on credit usage in August as revolving credit usage declined for the first time since May. At the same time, nonrevolving credit usage slowed from strong growth in July. Federal student loan debt continued to grow, topping $1.7 trillion, and borrowers should anticipate higher payments going forward following recent changes to the federal repayment framework. Overall, consumer credit in August increased at a slower pace than in 2025, when consumer credit rose 2.2% over the year.
Wholesale Trade: In August, merchant wholesalers’ sales, excluding manufacturers’ sales branches and offices, increased 1.8% from July and 15.6% from August 2025. The June to July 2026 growth was revised from an initial estimate of up 0.8% to up 1.0%. Durable goods sales rose 2.5% in August and 20.3% from August 2025, while nondurable goods sales stepped up 1.0% and 11.1% year-over-year.
Total inventories for wholesalers rose 0.5% in August and 6.4% from August 2025. Durable goods inventories moved up 0.8% in August and 6.3% year-over-year. At the same time, nondurable goods inventories stayed the same in August but grew 6.6% year-over-year. The overall inventories-to-sales ratio was 1.18 in August, down slightly from 1.19 in July and 1.28 in August 2025. Durable goods had a 1.45 inventory-to-sales ratio, while the ratio for nondurable goods was 0.90.